
Longitudinal observational data is repeated observations collected from the same patients or groups over time, without assigning treatment or intervention as part of the study. In clinical research, this type of data can help describe disease progression, treatment exposure, safety events, and outcomes in settings that are less controlled than a trial. This article uses a paediatric disease registry as a worked example, focusing on growth, sexual maturation and safety monitoring.
The use of population-based disease registries to support ongoing data collection for long-term safety and clinical outcomes is now well established in many long-term evidence-generation settings. Data collection methods within registries can vary in terms of completeness and quality.
This particular example arose from support to a post-registration commitment for marketing authorisation of a paediatric drug and aims to provide some insight into the techniques and strategies used to monitor paediatric development (growth, sexual maturation) and clinical outcomes of varying severity. The challenges of accounting for irregular follow-up and associated biases are illustrated, and potential statistical solutions described.
In Brief
- Longitudinal observational data follows the same patients or groups over time without assigning treatment as part of the study.
- In paediatric disease registries, it can support long-term monitoring of growth, sexual maturation, safety events, and clinical outcomes.
- The main analytics challenges include irregular follow-up, missing data, interval censoring, informative observation, and outcome-specific person-time.
- Repeated observations can show temporal patterns, but they do not by themselves prove that one factor caused another.
- The value of registry evidence depends on understanding how the data was generated, whether they fit the research, and how the uncertainty is reported.
Practicalities of working with longitudinal observational data from registries
Observational data originating from clinical disease registries are utilised in many therapeutic indications as a cost-effective means of collating 'real world' treatment experience on an ongoing basis. Such data can be particularly useful for chronic diseases where progression is likely and longitudinal information is required both for regulatory commitments and for long-term planning.
Use of disease registries has increased over recent years, as electronic data capture (EDC), data linkage, and structured registry processes have made ongoing data collection more feasible for clinical sites, provided that proportionate quality checks and source traceability are in place.
In contrast to randomised clinical trials, observational studies do not follow strict protocols for the timing of patient visits or clinical evaluations performed at each clinical visit, aiming to reflect the real-world clinical setting as much as possible. A cross-sectional study captures information at one point, whereas a longitudinal observational study follows patients or groups over time. This repeated follow-up can show temporal patterns, but it does not by itself prove that one factor caused another.
Consequently, statistical challenges typically relate to patterns of missing data, recording of events/endpoints that are retrospectively reported (recall/selection bias) and events occurring at unobserved, irregular time intervals (interval censoring).
Those practical challenges remain central, but registry studies also need to demonstrate that the data source is suitable for the specific research question. FDA guidance on registries and EMA guidance on registry-based studies both emphasise evaluation of data relevance and quality, including how key variables are defined and captured, completeness and consistency of follow-up, data provenance, quality-control procedures, and the ability to obtain or validate important outcomes and covariates.
Where registry data are linked to electronic health records, claims, laboratory data or other sources, linkage quality and the possibility of differential linkage should also be considered. Before analysis, the study team should define the target population, index date or time origin, exposure and outcome definitions, follow-up rules, potential confounders, censoring mechanisms and planned sensitivity analyses. These choices are especially important because the process that determines when a patient is observed may itself be related to disease severity or treatment.
Analysing growth data using longitudinal observational data
Chronic diseases evidenced in childhood can severely impact development. Height, weight and BMI can be compared to the World Health Organization (WHO) centiles. A point estimate (such as the last measured height in Fig 1A) can be plotted against the WHO centiles for a simple graphical display of a snapshot of development in this particular patient population at a specified time point.
Graphical techniques such as this can also be used to identify outliers (relative to the expected distribution) and potential data recording errors.
Fig 1A
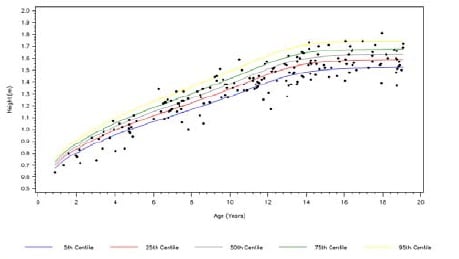
Fig 1B
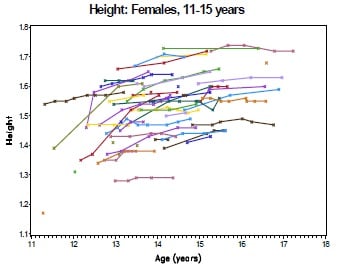
Fig 1C
The collection of longitudinal growth data enables an assessment of how the cohort's height and weight compare to international growth norms over the course of the study. In particular, we may wish to test for on-treatment improvement or deterioration in growth. In this setting, growth data is collected at irregular intervals and frequency on each subject (Fig 1B).
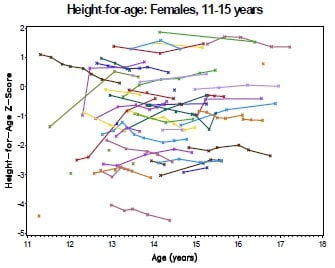
For each subject, height and BMI are put in the perspective of the height and BMI of healthy children of the same age according to the WHO Growth Standards, using the 'LMS' method (a simplified Box-Cox transformation) to relate the observed data to the Normal [0,1] distribution of the standard population [WHO 2007]. The resulting z-scores express 'height for age' or 'BMI for age' and are used as the endpoint for analysis (Fig 1C).
The WHO 2007 reference for children and adolescents aged 5–19 years remains available for height-for-age and BMI-for-age z-scores and percentiles. When applying an external growth reference, analysts should ensure that the age range, sex-specific reference and measurement definitions match the registry population and should document how implausible values and repeated measurements are handled.
One approach to modelling is to use a random slopes regression, respecting the within-subject correlations in the data (Fig 1D). The fixed effect estimate from this model is the average slope of change in height relative to the international norm. Non-linear extensions to this model should also be considered.
Fig 1D
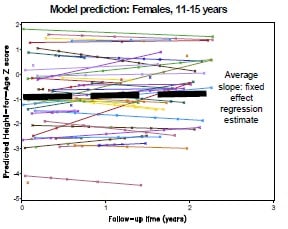
Fig 1E
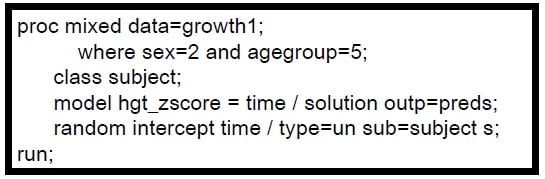
Mixed-effects models remain a natural choice for many irregularly measured continuous outcomes because they can accommodate different numbers and timings of observations while accounting for within-subject correlation. Depending on the scientific question and data-generating process, alternatives or extensions may include flexible splines for nonlinear trajectories, generalised mixed models for non-continuous outcomes, or joint models when longitudinal measurements and time-to-event outcomes are related.
Dangers lie in interpreting such irregular data, as apparent sub-group trends can result from imbalances in visit frequency of extreme subjects. In addition, there is often interest in charting the progress of subjects in the extreme percentiles, an approach that may be susceptible to 'regression to the mean' bias.
A further concern is informative observation: children whose health is worsening may attend more often, whereas clinically stable patients may have longer gaps between visits. Descriptive plots of visit frequency and timing, analyses of missing-data patterns, and sensitivity analyses that explore assumptions about the observation process can therefore be as important as the choice of longitudinal model itself.

Analysing sexual maturation with censoring
Sexual maturation was measured using the Tanner Stage, assessing puberty/genital development on a 5 point categorical scale (From Stage 1: pre-pubescent to Stage 5: adult). Irregular follow-up yielded snapshots of a subject's current Tanner Stage. To assess age of onset at a particular Tanner Stage (2 to 5), parametric survival methods were applied, assuming Normality for age of onset.
For each patient, age last observed in a given Tanner Stage and first observed in a subsequent stage determined left, right or interval censoring (Fig 2A).
Fig 2A
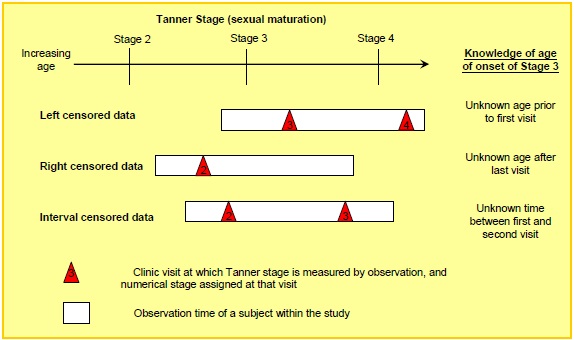
The full transition through the 5 Tanner stages of sexual maturation may take 5 years or more, therefore a cohort study with just a few years observation will have a greatly reduced sample size to assess age of onset of each individual stage (e.g. 40 of 209 females in Fig 2B contributed to the estimate for stage 3). The confidence intervals for the median age of onset are therefore wide.
However, the appropriately censored estimate makes full use of available data and avoids errors of reporting bias, for example from parental reports, and simplistic approximations such as 'the subject is observed midway between stages'. The estimates were made allowing for the 3 patterns of censoring in Fig 2A using PROC LIFEREG in SAS under a Normal parametric assumption, after examining alternative parametric distributions.
These estimates can be compared with the historical 'norms' established by Marshall and Tanner in 1969.
The principle remains valid today: the analysis should respect what is actually known about the transition time rather than replacing an interval with an arbitrary midpoint. Current analyses may use parametric or semiparametric interval-censored survival methods, with model choice and sensitivity analyses driven by the estimand and the available data. Historical Tanner references can provide context, but their age, population composition and assessment methods should be acknowledged when interpreting comparisons.
Fig 2B: Illustrative Tanner-stage estimates
|
Figures are medians and 95% confidence intervals |
Females (Total n=209) |
Males (Total n=167) |
|
Stage 2 |
9.5 (8.0 - 11.1) |
12.5 (10.6 - 14.4) |
|
Stage 3 |
13.1 (12.1 - 14.1) |
13.0 (12.0 - 14.0) |
|
Stage 4 |
15.5 (14.3 - 16.7) |
16.0 (14.5 - 17.5) |
|
Stage 5 |
17.2 (15.4 - 19.0) |
(no model convergence) |
Monitoring safety with person-time denominators
In an observational setting where subjects can enter or exit the population cohort at different times, adverse events can be summarised as event rates, involving the summation of each subject's observation time (Fig 3A). Calculation of observation time can be complicated by considering a variety of possible mechanisms for entry to and exit from the cohort, as well as possible multiple episodes of observation, for example when considering on-treatment exposure.
Fig 3A
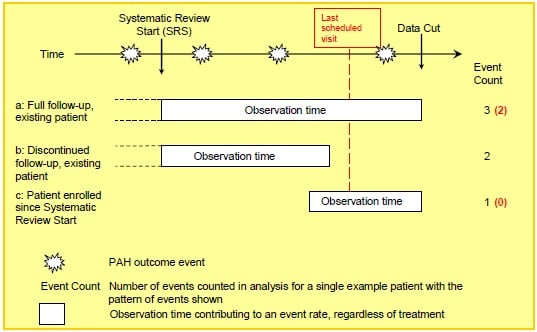
For current safety analyses, the definition of time at risk should be prespecified and clinically justified. Depending on the outcome, this may involve treatment-emergent windows, lag periods, risk windows after discontinuation, recurrent-event rules, or separate definitions for outcomes captured passively through linked records versus outcomes that require active clinical assessment.
Fig 3B: Example event rates for graduated outcomes
| Number of Events | Person years | Rate per 100 person years | |
| Increased Liver Enzymes | 5 | 213.8 | 2.3 |
| Hospitalization | 43 | 257.6 | 16.7 |
| Death | 10 | 257.6 | 3.9 |
Under a passive cohort surveillance, the 'severe' outcomes such as hospitalisation and death will be detected at any time until data cut as the outcome is linked to routine medical records systems. 'Mild' outcomes that require a clinic visit will not be detected between the routine visit appointments for registry participants, unless the subject makes an unscheduled clinic visit for other reasons.
In Fig 3B, the person years for mild outcomes is adjusted downwards by subtracting observation time after the last recorded visit.
This distinction is a reminder that both the numerator and denominator may depend on the outcome-ascertainment process. For example, hospitalisation and mortality may be captured reliably through linked records after a patient's last registry visit, while symptoms, laboratory abnormalities or less severe events may only be observed when the patient attends. Analyses should therefore align the person-time denominator with the period during which each outcome could realistically have been detected.
Reporting longitudinal observational data clearly
For regulatory or other high-stakes applications, reporting should make the main design and analysis decisions clear. Protocols and statistical analysis plans should prespecify key design and analysis decisions where possible, while data-management processes should preserve provenance and enable traceability from source data through derived variables to final results. ICH M14, adopted in 2025 for non-interventional studies using RWD for medicine safety assessment, reinforces principles around planning, design, analysis, reporting, bias assessment and transparent communication of study limitations.
For paediatric registries, these principles sit alongside practical challenges that are particularly important in children: rapid changes with age and maturation, small numbers in specific developmental stages, changing treatment patterns, dependence on caregivers for some reports, and long follow-up horizons. The statistical method should therefore follow from a clear understanding of the clinical pathway, data collection process and estimand rather than from the availability of a particular software procedure.
Conclusion
In conclusion, understanding the mechanism of the registry, alongside a thorough understanding of the disease and population being studied, is crucial in assessing the usefulness and subsequent modelling of registry data. The same principle applies to current longitudinal observational data; understand how and why the data was generated, define the question and analysis clearly, evaluate the data source against the question, and communicate residual uncertainty proportionately.
Quanticate’s statistical consultancy team supports sponsors with longitudinal observational data strategy, registry-based analysis, and the statistical interpretation of real-world clinical evidence. If you would like to discuss how to handle irregular follow-up, missing data, censoring, or person-time denominators in your longitudinal observational study, request a consultation with our team.
References
Marshall WA and Tanner JM (1969) Variations in pattern of pubertal changes in girls. Arch Dis Child 1969;44:291-303.
Development of a WHO growth reference for school-age children and adolescents. Bulletin of the World Health Organization 2007;85:660-7.
U.S. Food and Drug Administration (2023). Real-World Data: Assessing Registries To Support Regulatory Decision-Making for Drug and Biological Products. https://www.fda.gov/regulatory-information/search-fda-guidance-documents/real-world-data-assessing-registries-support-regulatory-decision-making-drug-and-biological-products
European Medicines Agency (2021). Guideline on registry-based studies (EMA/426390/2021). https://www.ema.europa.eu/en/human-regulatory-overview/post-authorisation/patient-registries
ICH (2025). M14: General Principles on Planning, Designing, Analysing, and Reporting of Non-interventional Studies That Utilise Real-World Data for Safety Assessment of Medicines. https://database.ich.org/sites/default/files/ICH_M14_Step4_Final_Guideline_2025_0905.pdf
World Health Organization. Growth reference data for 5–19 years. https://www.who.int/tools/growth-reference-data-for-5to19-years




.png?width=110&name=ACDM_Corporate_Member_Badge_135%20(3).png)
.png?width=140&name=cdisc_gold_partner_80h%20(2).png)
