<img alt="" src="https://secure.perk0mean.com/171547.png" style="display:none;">

TECHNOLOGY

Clinical Data Visualizations

Are you tired of clinical data visualization platforms that offer you hundreds of different options, but make it almost impossible to get the right one?

Where choice overwhelms, and getting the answers you need from your data is much harder than it should be?

At Quanticate, we take a different approach with our clinical data visualizations. 
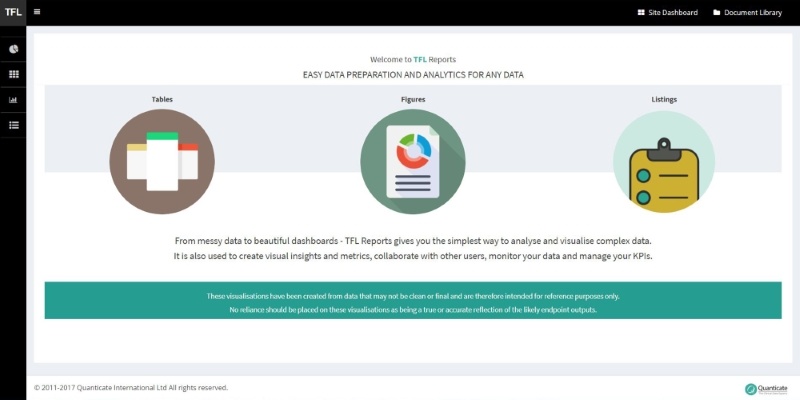
Using our expertise in statistical consultancy, we pick the most appropriate data visualizations for you, to allow you to quickly find the information you need from your data. Instead of a surfeit of options too hard to pick through, we give you just the ones you need when you need them.

Erroneous Data

Drawing in data from a variety of sources and Electronic Data Capture / Clinical Data Management systems, our interactive Erroneous Data platform will identify potential outlying study sites, patients or countries. Coupled with our interactive standard Table Listings & Figures, you can analyze your clinical data in near real time, drilling down to find the information you need on key endpoints and risk indicators. All trial data that is input into the platform, performing on-going quality checks to ensure that when data sets are submitted to authorities it is of sufficient quality to facilitate approval. This will also facilitate the implementation of a Risk Based Monitoring approach and the rigorous analysis of the selected KPIs for the trial.

The tests involved here are fully automated and will involve the interrogation of all collected trial data. However when the results of these tests are displayed within the comprehensive and user friendly visualization interfaces, these can be a powerful tool for informing clinical decisions. The resulting visualization of clinical data results enables Clinical Operations staff or Clinical Data Managers to easily drill down into outliers and determine the corrective action required if any.

This will assist in clinical project managers, with the assistance of clinical data managers detecting erroneous data from habitual transcription errors, poorly calibrated clinical equipment, site misunderstanding of the protocol or in a minimal number of cases, fabrication of data or fraud.

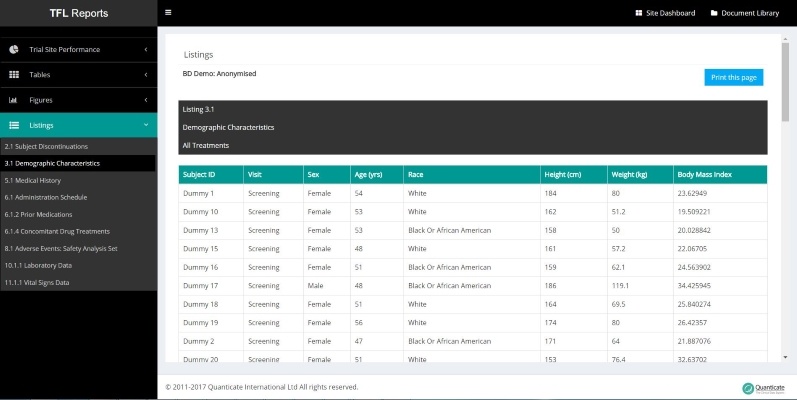
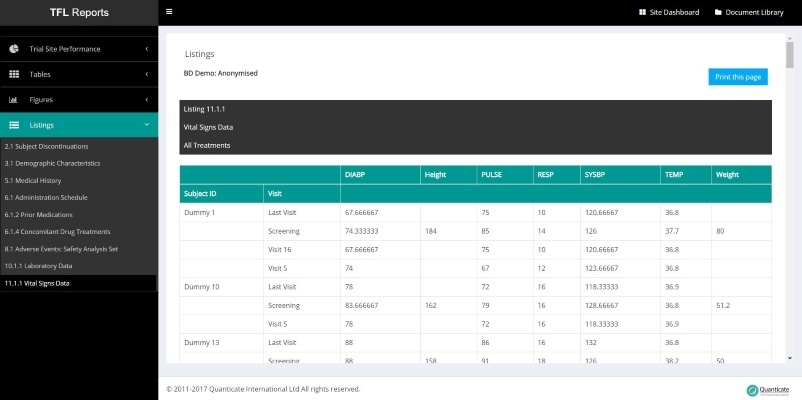
Tables, Listings, Figures

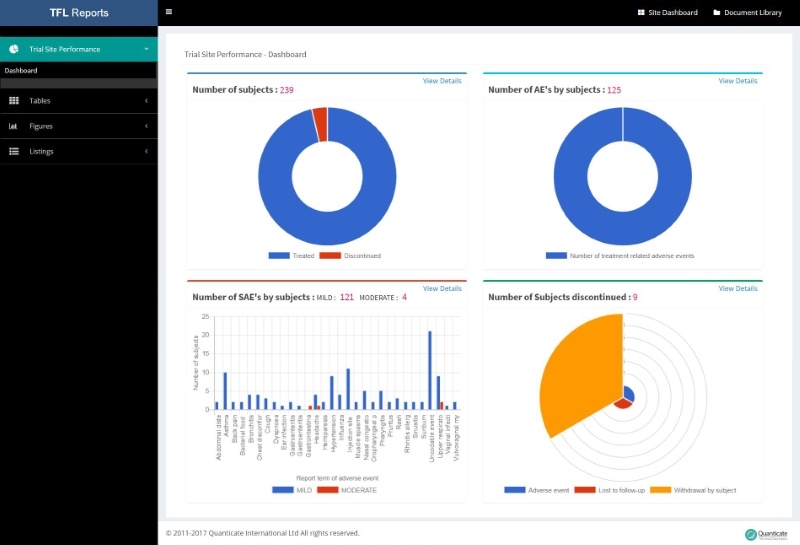
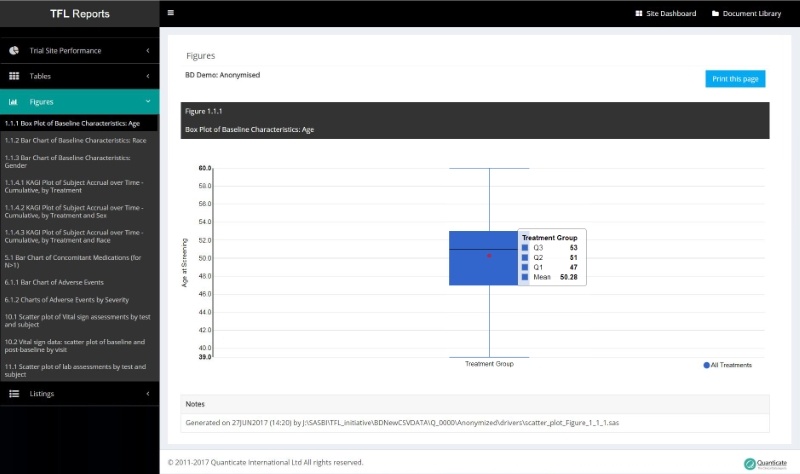
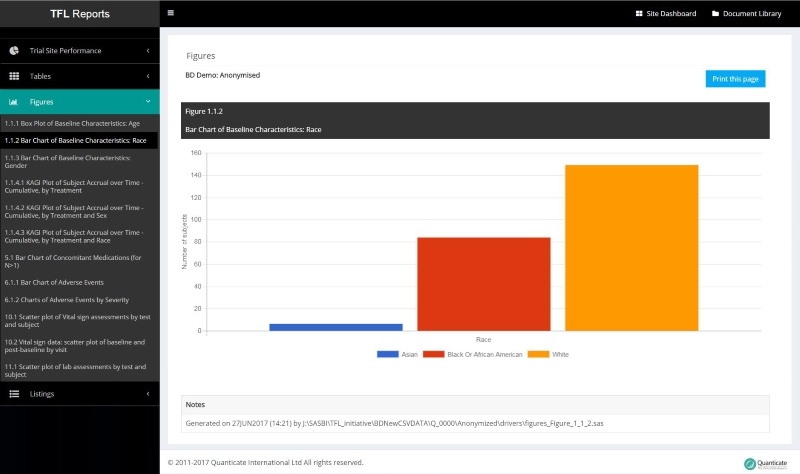
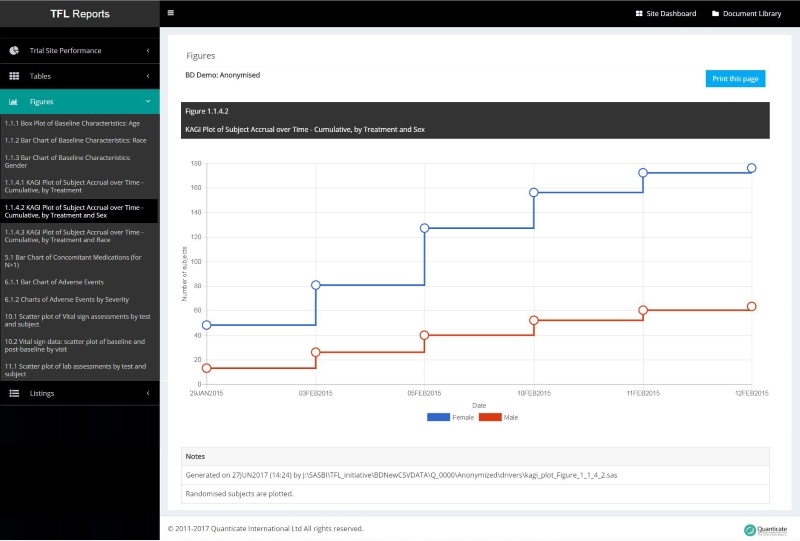
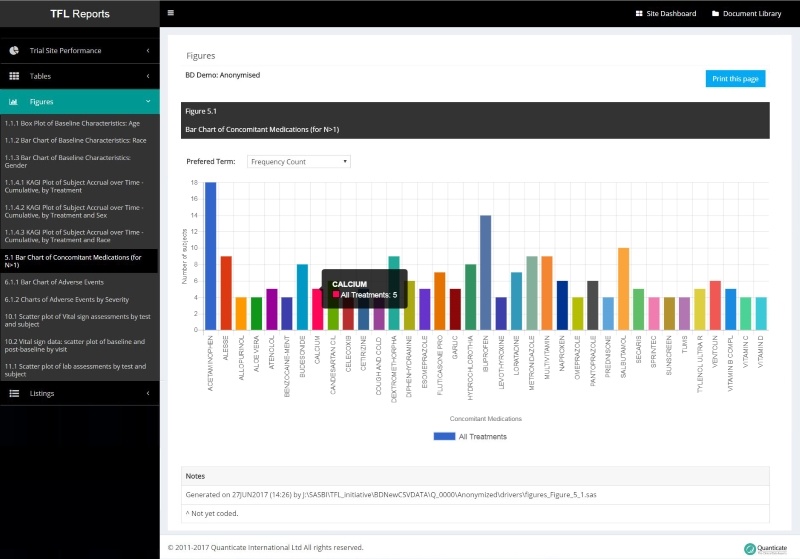
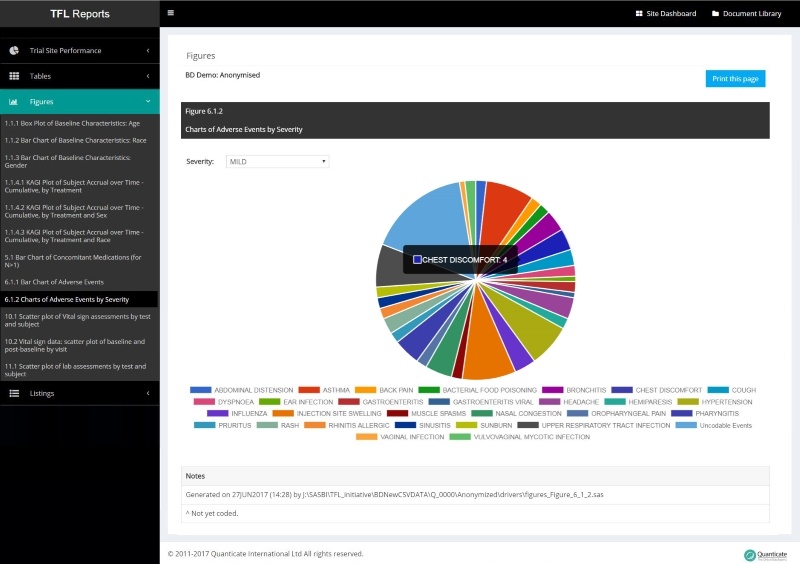
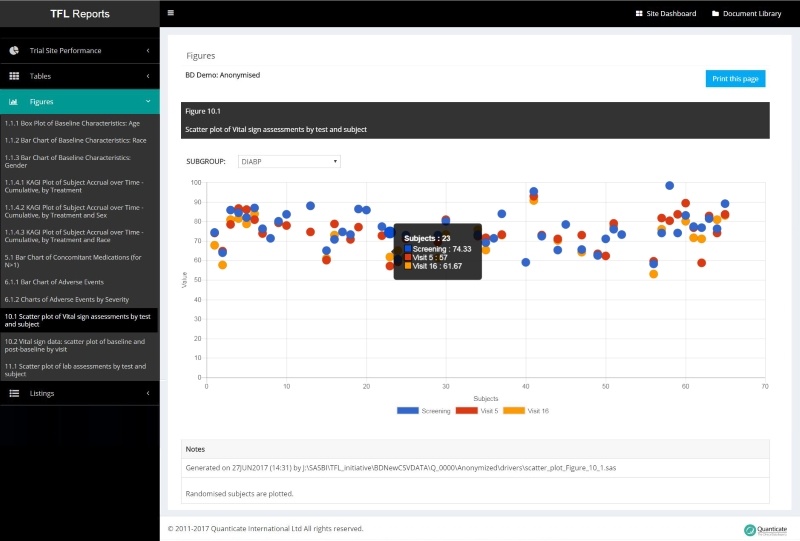
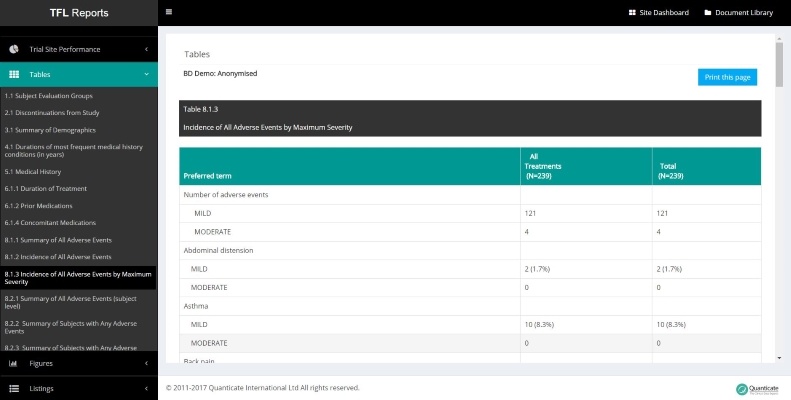
For our Clinical Data Management customers, Quanticate offers an advanced, interactive TLF platform. This standard suite of Tables, Listings and Figures (TLFs) is available at no additional cost. These near-real time reports permit customers to review the progress of their study in advance of database close, allowing project teams to take a step back from the data and view the trial as a whole. These standard TLFs cover most major interests across study areas; additional custom reports are available for a small charge. Reports include; Demographics, Medical History, Prior Medications, Concomitant Medications, Adverse Events and Vital Signs.

Clinical data visualizations resources

WHITEPAPER

Review what elements need to be considered when selecting an EDC platform

WEBINAR

Find out what it takes to develop a successful remote monitoring program

WHITEPAPER

Discover a cost effective alternative to traditional trial monitoring with rSDV

WHITEPAPER

Learn more about the core components of a Statistical Monitoring Report