 SAS [1] is regarded as the industry standard for clinical data analysis and reporting; however, Phoenix WinNonlin[2], which is a powerful tool tailored to the specific demands of PK data, is widely accepted as the industry standard for PK data analyses. This widespread separation of responsibilities, and the resultant transfer of data between software applications (and in many cases departments), has the potential to not only cause significant reporting delays, but can also lead to incohesive clinical study reports (CSRs) containing tables, listings and figures (TLFs) derived from various different sources.
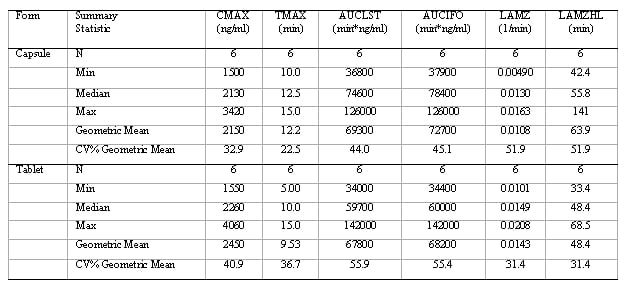
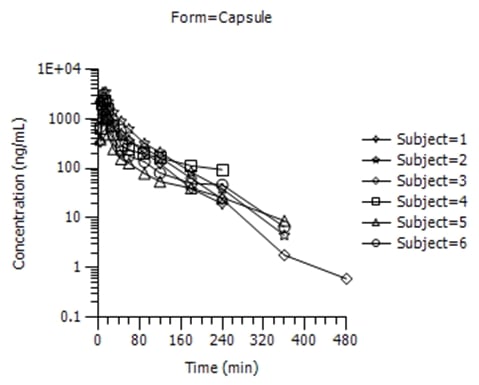
Figure 1: Aesthetic differences between SAS and Phoenix WinNonlin outputs
SAS
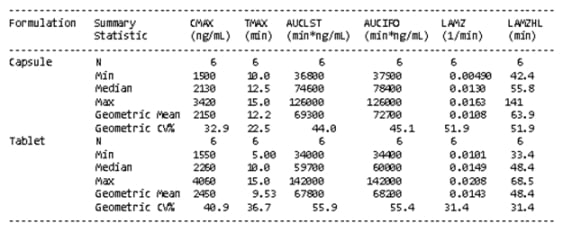
WinNonlin
SAS
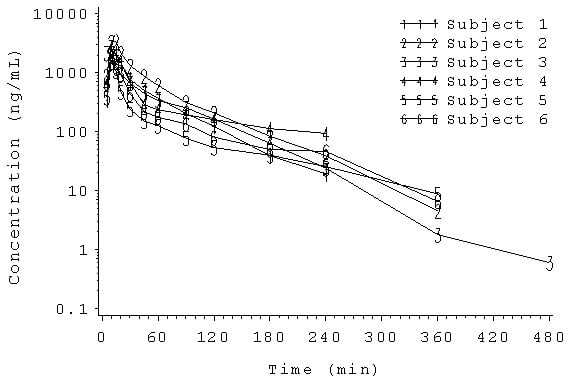
WinNonlin
Phoenix WinNonlin’s advanced reporting capabilities are very useful when compiling stand-alone PK reports, facilitating rapid illustration of PK data through workflows and templates; however, when results are integrated into a large CSR, it is often preferable to generate TLFs in SAS for consistency with the remainder of the clinical report (e.g. safety and efficacy data). Devising robust procedures using SAS transport files and CDISC nomenclature enables a readily switch between Phoenix WinNonlin and SAS (not to mention other software packages such as NONMEM[3]) to produce TLFs in a format which is suitable for each individual study’s reporting requirements. Although the main aspect of any PK analysis should be ensuring that the correct approach has been used (e.g. model selection, etc), the presentation of results should not be underestimated; the visual appearance of data plays a key role in facilitating a clear understanding of whether or not key study objectives have been attained.
Figure 2: Typical PK workflow using SAS and Phoenix WinNonlin
So, is it best to use SAS or Phoenix WinNonlin for PK data analysis and reporting? With some careful forward planning, why not use both? This seamless approach, coupled with a robust catalogue of pre‑defined SAS programs and macros not only removes potential data‑exchange delays, but improves consistency between outputs, augments quality control (QC) procedures and improves reporting timelines.
Related Blogs
- The Creation of ADaM Datasets for Pharmacokinetic (PK) Analysis [Video]
- Pharmacokinetic Considerations of Biosimilars
- Performing CDISC Compliant Pharmacokinetic Analyses
References
[1]SAS Institute Inc.,Cary,NC,USA.
[2]Pharsight Corporation Inc.,Mountain View,CA,USA.
[3]ICON Development Solutions,Ellicott City,MD,USA.


