The laboratory dataset is one of the core safety datasets and, at first glance, it could appear intimidating, with multiple tests and visits per patient. This article will illustrate checks that are worth applying at the very beginning of programming work – these could be in addition to the standardised process of domain validation. In addition, we cover comparing R and SAS, handling of local vs central lab data, macro utilities in SAS, baseline value assignment, and best practices for lab data standardisation and process improvement.
Early identification of laboratory issues will allow you to:
- ensure data quality long before the database lock
- increase work efficiency and the quality of the data provided by the programming team
- prevent data loss due to unmapped or non-standard values
- pool data easily and reply to regulatory agencies faster
- communicate efficiently across departments/ companies that apply the same standards, for example, cooperation between Programming and Medical Writing
Laboratory Dataset in R
Understanding the fundamentals in R is equally important to know how laboratory data is handled in SAS, especially in modern data science and statistical workflows.
The laboratory datasets in R are a critical part of clinical trial data analysis. Laboratory data contains vital information about patients’ health indicators such as blood counts, liver enzymes, and other biomarkers. Working with this data in R involves a structured process that ensures accuracy, compliance, and readiness for regulatory submission.
The first step is data import, where lab datasets—usually in CSV, Excel, or SAS formats—are loaded into R using functions like read.csv(), read_excel() from the readxl package, or read_sas() from the haven package. Once imported, the data is stored in a data frame, which is the primary structure used for data manipulation in R.
Next comes data review and exploration. This involves using functions such as str(), head(), and summary() to examine the structure, identify data types, check for missing values, and understand the overall layout of the dataset. Understanding the format is essential. After exploration, data cleaning and transformation take place. This stage includes handling missing or inconsistent data using functions like na.omit(), mutate(), and filter() from the dplyr package. It’s also important to standardise units and values across different lab tests to maintain consistency.
Understand the Domain
The laboratory domain (LB) captures laboratory data collected in the case report form (CRF) or received from a central provider or vendor. Very often there are only two values to be summarised per subject and parameter: baseline and maximum on treatment value. For example values outside the normal ranges and toxicities, as defined per National Cancer Institute Common Terminology Criteria for Adverse Events (NCI CTCAE), may also be summarised. There are also other toxicities grading systems including Rheumatology Common Toxicity Criteria (RCTC) and Division of Aids (DAIDS) to name a few that could be considered. Sometimes laboratory test values are summarised per treatment cycle or epoch, more complicated outputs include:
- Summarising abnormalities overlapping with other abnormalities or specific Adverse Events. One example is Hy’s Law analysis.
- CTC grades analysis, including shift tables.
Study Requirements
Before the statistical programming commences, there are few preparatory actions which should be completed:
- Check the analysis plan and table mocks to determine the programming outputs that are required.
- Discuss how to handle duplicates with the study team.
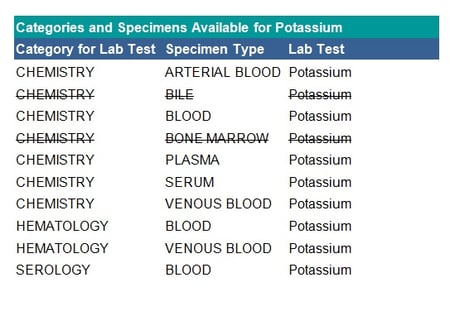
- Review available tests, specimen types and categories for potential exclusions.
- Verify the sorting key (Clinical Data Interchange Standards Consortium (CDISC) recommendation is that you have one record per laboratory test, time point, visit and subject).
- Exclusions may also be performed on the category level (for example: urinalysis), specimen level or test level.
See the table below for an example of specimen exclusions for potassium:
Mapping Checks
In addition to the study requirements discussed above, the following mapping checks are suggested:
- Check if each test has a unique category. When reporting by laboratory category, if a test is assigned to multiple categories (as shown in the table above) this may result in the same test being reported in different tables. In this case, verify in which table each test belongs, for example, the haematology category may feed into chemistry or be a separate table.
- Check if specimens should be grouped for reporting, for example, the three specimens: arterial blood, blood and venous blood can all be mapped to blood.
- Examine if test codes and names map one-to-one at least within a category. Below is an example of mapping laboratory test names.
 Note: The example above is using CDISC Mapping.
Qualitative Values
Not all tests will have continuous numeric results, examples may be urinalysis tests like ketones, glucose, and protein. Qualitative values can be mapped as follows:
- to other qualitative values: N, NEG, NEGATIV, NONE-DETECTED → NEGATIVE
- to quantitative values: ++, +++, ++++, +1, 1+, POSITIVE, Positive → 1
>60 → 60.01
Simple mapping of collected terms to standardised terms can be done in the SDTM datasets, however, this does not include imputations such as >6 → 60.01 which should be done in the analysis ADaM dataset instead as no imputations should be done in the SDTMs. Care should be taken to follow the CDISC Implementation Guides for how to populate the Original, Standard and Analysis results across the datasets. If there are no units associated with a result it does not necessarily mean that it is qualitative. Example tests with quantitative results and no unit are pH or Specific Gravity.
Conversion of Units
There is the possibility to choose from many unit standards, which one to follow is up to your clinical team. Some example standards are the Système International (SI) unit, the U.S. Conventional units or Client-specific standard. See table below for examples of the differences between units:
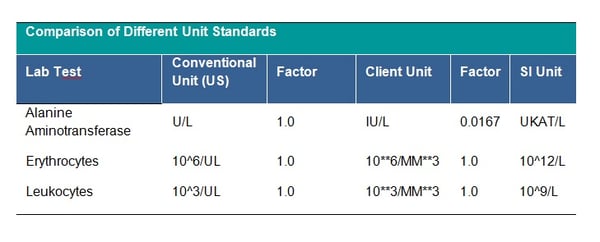
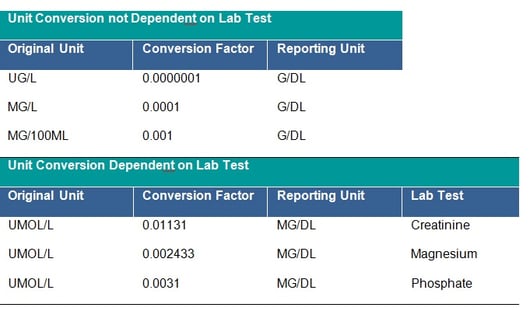
It is strictly recommended to check that all units follow the agreed standard, if not, unit conversion should be applied. The unit 10**6/MM*3 for CDISC STDM should be mapped to CDISC Controlled Terminology equivalent. This is a CDISC SDTM requirement and all units should be mapped to the equivalent CDISC CT Submission Value where possible. Conversion of units is done by multiplying the original lab test value by the specified conversion factor. The clinical team will provide you with missing conversion factors; these would also be needed to convert lower and upper limits of the reference range where populated, unless new ranges are being applied for consistency across the dataset. Conversion may depend on the laboratory test – see tables below:
 In addition, the checking of outliers in the converted observations is recommended as sometimes the initial unit is incorrectly assigned and the conversion was not in fact needed.
Conversion of units may be time-consuming, especially if each non-standard unit is handled separately. This would also significantly increase the size of the SAS program and make the code cumbersome to read. It is therefore worth considering writing a reusable program for unit conversion.
The initial step for the conversion process would be making sure that the laboratory dataset contains the standard unit for each test, i.e., the unit that will be used for the reporting; exceptions are laboratory tests for which units are not required. It is good practice to keep a list of reporting units in an external file (.txt, .csv, .xls), which in this form can be easily read in SAS and transformed to a SAS dataset; moreover, all potential updates will require only an update to the external file and rerun of a previously created code.
If a dataset of conversion factors is not provided to the programming team, it can be created by programmers and submitted for clinical review and approval. For conversions which are not dependent on the test (for example g/dL to g/L), the dataset with conversion factors should contain at a minimum: original unit, conversion factor and reporting unit. For conversions specific to the laboratory tests the dataset should additionally contain variable(s) allowing identification of the test, such as the Lab Test Code or the Lab Test Name. The final dataset should contain unique records only, in order to avoid duplication of laboratory records.
The below macro call can be used for merging the laboratory dataset with the dataset containing reporting units:
/* Macro for merging laboratory dataset (in_ds) with dataset containing reporting units (unit_ds) for each test.
Datasets are merged by common variables (byvars) which:
- are specific to the project,
- identify unique lab test.
Example merge key can be:
- Lab Test Name and Specimen Type, Lab Test Code, LOINC code.
‘all’ variable specifies the content of the output dataset (out_ds):
- only records with reporting unit found in unit_ds dataset (all=N) or
- all records, irrespective of the corresponding reporting unit found in unit_ds dataset or not */
%macro std_units(in_ds=lb, byvars=lbtestcd, unit_ds=units, out_ds=lb_unit, all=Y);
proc sort data=&in_ds. out=&in_ds.s;
by &byvar.;
run;
proc sort data=&unit_ds. out=&unit_ds.s;
by &byvar.;
run;
data=&unit_ds. ;
merge &in_ds.s(in=a) &unit_ds.s(in=b);
by &byvars.;
%if &all.=N %then
%do;
if a and b;
%end;
%else
%do;
if a;
%end;
run;
%mend std_units;
/* lb - laboratory dataset
conv - conversion dataset
factor - conversion factor variable
org_unit - original unit variable
rep_unit - reporting unit variable
lbtestcd - lab test code variable, in this example it is identifying variable for lab test. Lbtestcd is used to assign factors for conversion dependent on lab test (a.lbtestcd=b.lbtestcd); for conversion not dependent on lab test lbtestcd is missing in conv dataset. */
proc sql;
create table lb_conv as select a.*, b.factor
from lb as a left join conv as b
on upcase (a.org_unit)=upcase (b.org_unit)
and upcase (a.rep_unit)=upcase (b.rep_unit)
and (a.lbtestcd=b.lbtestcd or missing(b.lbtestcd))
order by a.lbtestcd;
quit;
- the original unit and the reporting unit are not equal
- the result in the original unit and factor variables are not missing
- the result is numeric (i.e. contains only digits and ‘.’)
The conversion of units is done by multiplying the result in the original unit by the specified conversion factor. As a result of calling the below macro, values are assigned to reporting unit, numeric and character result in the reporting unit and reference ranges for lower and upper limits. The macro parameter “&conv_ln” can be used to switch off the conversion of lower and upper limits; however the default and highly recommended option (presented below) is that the conversion is done. Additionally, the variable “convfl” is created to flag records that have been converted and to aid quality checks of the conversion.
In the example below a specific format for the results is not required, however, standard specific or study-specific numeric result precision may be expected.
/* conv_ln – macro parameter, specify if lower and upper limits of range should be converted (conv_ln=Y)
rep_unit – reporting unit
factor – conversion factor
convfl – flag for converted observations
standard CDISC variables:
lborres – result or finding in original units
lborresu – original units
lbsrtesu - standard units
lbstresn – numeric result/finding in standard units
lbstresc – character result/finding in standard format
lbornrlo – reference range lower limit in original unit
lbornrhi – reference range upper limit in original unit
lbstnrlo – reference range lower limit - standard units
lbstnrhi – reference range upper limit - standard units */
%macro conversion(conv_ln=Y);
%let conv_ln=%upcase l(&conv_ln);
if upcase(lborresu) ne upcase(rep_unit) and cmiss(factor,
lborres)=0 and findc(lborres, '.', 'dkt')=0 then
do;
lbstresu=rep_unit;
lbstresn=input(lborres, best.)*factor;
lbstresc=strip(put(lbstresn, best.));
%if &conv_lnest. = Y %then
%do;
lbstnrlo=input(lbornrlo, best.)*factor;
lbstnrhi=input(lbornrhi, best.)*factor;
%end;
convfl='Y';
end;
%mend conversion;
After conversion of units it is good practice to check the dataset for outliers as they may indicate data issues in the laboratory dataset. An example of a data issue is incorrect recording of prefix ‘micro’ in the unit and using incorrect symbol ‘m’ instead of ‘u’. Unit micromole per litre should be written as ‘umol/L’ however it may be wrongly assigned as ‘mmol/L’, resulting in 1000 times higher result than the actual value. Such cases should be reported to Clinical Data Management.
Conversion of Units in R
In addition to the SAS-based unit conversion methods, R offers another approach for converting laboratory test units.
# lb <- data.frame(ORRESU = c("UG/L", "MG/L", "MG/100ML", "UMOL/L"),
# LBTEST = c("Test1", "Test2", "Test3", "Creatinine"),
# ORRES = c(5, 20, 30, 100))
# Conversion table for units NOT dependent on lab test
unit_conversion_static <- data.frame(
ORRESU = c("UG/L", "MG/L", "MG/100ML"),
Factor = c(0.000001, 0.0001, 0.001),
ReportUnit = c("G/DL", "G/DL", "G/DL")
)
# Conversion table for units dependent on lab test
unit_conversion_dynamic <- data.frame(
ORRESU = rep("UMOL/L", 3),
LBTEST = c("Creatinine", "Magnesium", "Phosphate"),
Factor = c(0.01131, 0.002433, 0.0031),
ReportUnit = rep("MG/DL", 3)
)
# Apply unit conversion
lb$ConvertedValue <- NA
lb$ReportingUnit <- NA
for (i in seq_len(nrow(lb))) {
row <- lb[i, ]
# Check for static conversion
static_match <- subset(unit_conversion_static, ORRESU == row$ORRESU)
if (nrow(static_match) > 0) {
lb$ConvertedValue[i] <- row$ORRES * static_match$Factor
lb$ReportingUnit[i] <- static_match$ReportUnit
} else {
# Check for dynamic conversion
dynamic_match <- subset(unit_conversion_dynamic, ORRESU == row$ORRESU & LBTEST == row$LBTEST)
if (nrow(dynamic_match) > 0) {
lb$ConvertedValue[i] <- row$ORRES * dynamic_match$Factor
lb$ReportingUnit[i] <- dynamic_match$ReportUnit
}
}
}
# View converted dataset
print(lb)
The R code converts lab result units in a dataset using two reference tables. One table (unit_conversion_static) handles conversions based only on the original unit, while the other (unit_conversion_dynamic) considers both the unit and the lab test name. For each row in the dataset, the code checks for a matching conversion rule, applies the appropriate factor, and stores the converted value along with the new reporting unit. This standardises the lab results for consistent reporting.
Central and Local Laboratories
Central laboratories can be identified by a unique laboratory identifier or name/address which should be documented in a clinical data management plan, data transfer agreement, dataset specifications or similar document.Common issues with data from local laboratories are:
- missing or non‑evaluable result (for example, ‘less than 10’, ‘11-21’, ‘3 Plus’, ‘>=1000’)
- upper and/or lower limit ranges not provided
- non-standard/missing units or units concatenated with the result
Data obtained from a combination of central and local laboratories may also cause issues, for example:
- not including results from local laboratories in the outputs
- converting units only for local laboratories
- applying different parameters derivations for results obtained from local and central laboratories
While central laboratories ensure a standard approach and provide values in standardised units, it is not always the case with local laboratories. The macro below may be used to separate units concatenated to the value in the result variable (i.e. unit is included in the result variable and the unit variable is missing). Macro should be called within the data step for tests where numeric result is expected. It is assumed that:
- result value begins with number or ‘.’ in the case of missing result
- unit value starts with a letter, the macro will not work properly for units like ‘10^9/L’ or ‘10^6/UL
/*condition - macro parameter, used to specify subset of tests for macro
sepfl – flag for separated observations
old_lborres - holds value of lborres before separation
lborres, lborresu – standard CDISC variables, see code above *
%macro separate (condition);
if &condition. then
do;
lborres_=strip(lborres);
if anyalpha(lborres)>0
and (anydigit(substr(lborres_,1 ,1 ))=1 or
substr(lborres_,1 ,1 )='.')
and missing(lborresu) then
do;
old_lborres=lborres;
lborresu = substr(lborres_, anyalpha(lborres_));
lborres = substr(lborres_, 1 , anyalpha(lborres_)-1 );
sepfl='Y';
end;
end;
drop lborres_;
%mend separate;
Example calls may be:
%separete (lbtestcd in ('ALT' 'CA' 'BILI' 'K'))
%separate (lbcat ne 'URINALYSIS')
Assigning the Baseline Value
The Study Data Tabulation Model (SDTM) baseline flag should be used on team consent; otherwise, it may be necessary to ask for appropriate baseline definition. Baseline definition can be a specific visit or the last non missing result prior to first dose. While developing baseline algorithm, consider usage/ imputation of measurement time or time-points, imputation of missing/incomplete dates and inclusion of unplanned visit. Finally, it is important to clarify if subjects with no baseline are expected to be summarised in post-baseline or shift tables.
How can you develop the processing of laboratory data within your organisation?
- use a CDISC validator which will cover many checks described earlier
- have a designated laboratory subject matter expert
- develop a Best Programming Practices for Laboratory Domain document
- create a database of mapping decisions from studies that use the same standard or keep one study as a reference for mapping
- develop a list of standard QC checks for the laboratory domain
Develop standard macros to handle repeated steps, for example: read in and check the specification with a CDISC validator, perform the test/units mapping, read in/create codelists, convert units and derive baseline.
Comparing Laboratory Datasets in SAS vs R
Below, we can see the key differences between Laboratory Dataset Handling in SAS vs R, summarised across some important features.
| # | Feature | SAS | R |
| 1 | Language paradigm | Procedural DATA step & PROCs; SQL-like | Functional / OO; pipes & tidy-verse grammar |
| 2 | Data import & interoperability | Native CDISC/SDTM; Excel & Oracle connectors | haven, readr; bridges to Python, SQL, even SAS via haven |
| 3 | Data manipulation & cleaning | DATA step (IF / SET / BY); mostly manual QC | dplyr, data.table, janitor automate joins & cleaning |
| 4 | Performance & memory | Turned for very large clinical tables; efficient RAM use | Fast when turned (data.table); needs care with RAM |
| 5 | Statistical & multivariate analysis | MEANS, MIXED, PRINCOMP, FACTOR, etc | lm(), lme4, prcomp(), psych, factoextra |
| 6 | Machine-learning stack | SAS Viya, Enterprise Miner | caret, xgboost, tidymodels |
| 7 | Visualisation & dashboards | SGPLOT/GPLOT; limited dashboarding | ggplot2, plotly; interactive apps via shiny |
| 8 | Clinical standards & regulatory acceptance | Built-in CDISC & ADaM; FDA/EMA accepted | Manual CDISC setup; extra validation for submissions |
| 9 | Reporting, reproducibility, & version control | PROC REPORT, ODS; limited Git/SVN hooks - harder to track changes | rmarkdown, knitr with strong Git integration for full provenance |
| 10 | Batch & workflow automation | SAS batch jobs, schedulers | Rscript, batchtools, SLURM |
| 11 | GUI / IDE experience | SAS Studio, Enterprise Guide | RStudio, VS Code, Jupyter with interactive debugger |
| 12 | Package ecosystem & customisation | Smaller, proprietary add-ons; limited scripting | Vast CRAN/Bioconductor/GitHub; highly scriptable |
| 13 | Learning curve & community support | Easier for many clinical programmers; corporate support | Steeper, but huge open-source community & resources |
| 14 | Cost & licensing | Commercial license, high cost | Free, open-source |
Laboratory Data Standardisation with SAS
Laboratory data standardisation using SAS is a critical process in clinical research that ensures lab results are consistent, reliable, and compliant with regulatory requirements. In clinical trials, laboratory data is collected from various sources such as central labs, local labs, and electronic data capture (EDC) systems. These sources often use different formats, measurement units, naming conventions, and reference ranges. To make this data suitable for analysis and submission to regulatory bodies like the FDA or EMA, it needs to be standardised.
SAS is widely used for this purpose because of its powerful data handling and automation capabilities. With SAS, clinical programmers can clean and transform raw lab data by harmonising test names, converting units to a standard scale, applying consistent reference ranges, and flagging abnormal results. Data mapping is also performed to align the data with standardised formats required by regulatory standards such as CDISC SDTM. This may include joining lab data with metadata, applying controlled terminology, and generating submission-ready datasets.
SAS allows for automation through macros and reusable programs, making the standardisation process more efficient and reducing the risk of manual errors. Additionally, extensive validation checks are performed using SAS to ensure data accuracy and completeness. This standardised lab data is then used for generating statistical summaries, safety reports, and regulatory submission packages. Overall, laboratory data standardisation with SAS plays a crucial role in maintaining data quality, ensuring regulatory compliance, and supporting reliable clinical trial outcomes.
Conclusion
In summary, early checks and standardisation of laboratory datasets are crucial for ensuring data accuracy and consistency across clinical trials. By implementing proper unit conversions, whether using SAS or R, and adhering to standardised processes, programming teams can significantly enhance data quality and streamline workflows. Additionally, the integration of automated tools, like macros and reusable conversion scripts, can save time and reduce errors, ensuring that lab data is ready for analysis and regulatory submission. Ultimately, fostering collaboration across teams and adhering to best practices will lead to more efficient and reliable clinical trial outcomes.

At Quanticate, our statistical programming team is dedicated to transforming complex laboratory datasets into reliable, analysis-ready outputs using both SAS and R. From early validation and mapping strategies to automated unit conversion and regulatory alignment, we ensure data is clean, consistent, and compliant at every step. Whether you're standardising across local and central labs or navigating CDISC requirements, our experts apply best practices and scalable automation to deliver accurate, submission-ready datasets. If you're looking to streamline your lab data workflows and enhance the quality of your clinical trial outputs, request a consultation below to discover how we can support your study.
Related Blog Posts: