The Importance of SAS Quality Control in Clinical Trials
Quality control (QC) in clinical trials is essential for ensuring the integrity and reliability of data. Leveraging SAS (Statistical Analysis System) for QC processes offers a powerful solution for clinical researchers. SAS provides comprehensive tools for data analysis, reporting, and validation, making it an ideal choice for QC tasks. By integrating SAS with robust QC methodologies, clinical trials can achieve higher standards of accuracy and compliance.
In clinical trials, double programming is a widely accepted practice aimed at enhancing the reliability of the data analysis process. This method involves two independent programmers developing the same statistical programs—such as Standard Data Tabulation Model (SDTM) datasets, Analysis Data Model (ADaM) datasets, or Tables, Listings, and Figures (TLFs)—separately. The core steps of double programming include:
- Independent Development - Each programmer creates their own set of programs to generate outputs based on the same specifications. This independent development ensures that any errors or discrepancies are more likely to be identified.
- Comparison of Results - Once both programmers have completed their tasks, their outputs are compared. This is often done using tools like PROC COMPARE in SAS, which helps to identify discrepancies between the two sets of results. The comparison focuses on ensuring that the outputs are consistent and meet the required standards.
- Peer Review - After the comparison, a peer review is conducted. This step involves a thorough examination of the outputs by another senior programmer or statistician. The peer review serves as a final check to confirm the accuracy and consistency of the results before they are delivered to the client.
Double programming plays a crucial role in identifying and correcting errors or inconsistencies before final data analysis and reporting. This practice not only enhances data reliability but also ensures that any issues are addressed early in the process, thereby improving the overall quality of the clinical trial data.
This blog post explores the how SAS and UNIX can be used to create a QC batch program for clinical trials, highlighting best practices and practical applications to enhance data quality and reliability. Unlike the double programming method, which relies on manual, independent development and comparison of outputs by two programmers to ensure data accuracy, QC batch programs leverage automation to streamline the QC process. By using SAS scripts and UNIX batch programming, repetitive QC tasks such as re-running QC programs, checking for standard outputs, and validating data consistency across datasets can be automated, reducing manual effort and the likelihood of human error.
What is SAS UNIX?
SAS is a powerful tool for data management, statistical analysis, and reporting commonly used in clinical trials and other fields. Typically, SAS programs are designed to operate on a single file and are not well-suited for making changes to a directory's folder structure or applying consistent modifications across multiple files in a single directory. SAS UNIX refers to the use of the SAS software on UNIX-based operating systems, such as Linux, AIX, or Solaris, which provides enhanced capabilities for batch processing, automation, and the integration of SAS programs with other powerful UNIX tools. For instance, the %SYSEXEC macro statement (as seen in the sas quality control in clinical trials example) can be used to switch to the operating environment mode, allowing users to execute UNIX commands directly within a SAS session. This approach makes it possible to handle tasks like file manipulation, data processing, and automation without leaving the SAS environment.
SAS Quality Control Example
This QC example in SAS is based on a client request to build a robust system which reacts to display creation; finds and runs the related QC programs automatically, and compiles the information in one central place. This needs to work for multiple studies with differing standards.
To start the process first a statistical programmer must consider all scenarios and tease out all the nuances of the system to create a system (the batch program).
Project Planning
To build any system, a lot of in depth thought is required before any programming begins. Programmers take the requirements and build a robust system to address each potential scenario that may arise, including some which should not.
All possible questions/issues and other considerations should be brainstormed. This approach helps focus the programmer on the requirements and enables identification of areas for the client to consider. This is a fundamental part of a programmers role before starting a request.
Some of the considerations to a request are:
- What aspects are there to creating a robust system?
- Should there be restrictions on who can run the system?
- How will we monitor who runs the system?
- How will this work across the different reports of data?
- How are we going to gather the required information?
- How will we link the information?
- What will be the default settings?
- Where will we define the default settings?
- What is the new directory structure?
- What sub folders are required?
- What will be the QC naming convention?
- Do we need to consider switching code on/off?
- How can we maintain and update the QC information?
- What are the assumptions?
Breaking down the task
After all the brainstorming, we gather all the questions and create an order to these, i.e. in terms of how the quality control batch program will work. The client should be kept informed of progress and any issues discussed to ensure the initial top level requirements have been interpreted correctly. Without the clients involvement at this stage, there is the potential risk of creating an improved system and wasting time if it was not originally required in the first place.
Therefore we break down the items as follows, which will be considered separately throughout this article:
- Setting up the environment
- Directory structure
- QC programming naming convention
The main components of the process includes:
- Setting up the QC reporting environment
- Checking the displays vs QC programs available
- Copying QC programs from MASTER directory
- Running the QC programs
Setting up the Environment
To begin with we need to set up the environment, but to do this we need to first consider how and where we are going to define this information to enable the environment to be set up with ease.
Having one key program defined (GLOBPROT.SunixAS) with all the relevant information means that we can use this key program to set up the environment but also utilize this program in every other program thereafter. This means that we can have a suite of standard programs which call the specific GLOBPROT.SAS which has all the settings for that specific reporting delivery.
What information do we require to be included in this specific GLOBPROT.SAS for our client?
- Date of the reporting effort: e.g. 26SEP2011
- Type of deliverable: e.g. SRT, CSR etc.
- Standard “Client” macro library path
- Formats
- Subsetting code
- Macro vars including:
- outdir_lib: Display directory
- m_lib: QC Master directory
- q_lib: QC Reporting effort directory
- Anything else relevant to our specific reporting needs
Directory Structure
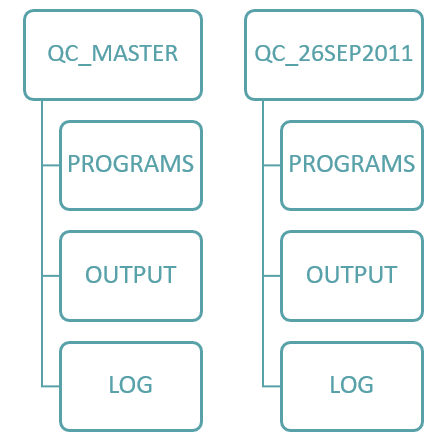
When developing a directory structure, keep it simple, you want the users to become familiar with this new directory structure immediately. There will be a directory created called QC_MASTER and underneath this sub directories PROGRAMS, OUTPUT, LOG etc.
Note: Underneath the QC_MASTER/programs the master copies of the programs will reside.
For each reporting delivery there will be a directory called QC_snapdate (e.g. QC_26SEP2011) and mirroring the QC_MASTER directory the same subdirectories will be created.
The easiest way to explain this is diagrammatically:
Figure 1: Diagrammatic representation of the directory/sub-directory structure
QC Programming Naming Convention
Again there needs to be a simple method used so that it may be applied to all with ease.
For this particular client the display name followed a specific pattern so it was easy to apply. By taking the original display name to be QCed and stripping this back to create a linking variable, the QC program name can then be assigned.
Figure 2: Diagrammatic representation of how the QC programming naming convention was derived
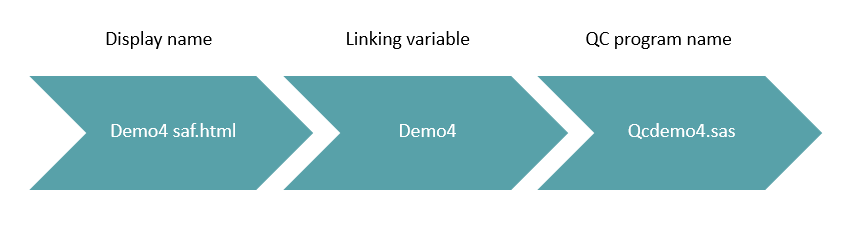
The linking variable is a key variable within the program. Without this the batch program will not function properly. This variable will enable us to define the status flag for each display within the batch program, this will be discussed later.
The Main Components of the Process
There are six main components of the process:
- Setting up the QC reporting environment
- Checking the displays vs QC programs available
- Copying QC programs from MASTER directory
- Running the QC programs
- Checking the QC logs
- Copying the information back to file
The batch program was developed with the above in mind but by allowing each of the components to be driven independently using macro variables enables as much flexibility with the code as possible. The macro variables are highlighted in bold below:
- P1_NEWDIRYN=Y: Setting up the QC reporting environment
- P2_QCVSOUTYN=Y: Checking the displays vs QC programs available
- 2a] Displays to be QCed
- 2b] QC programs already in QC reporting effort
- 2c] QC logs already in QC reporting effort
- 2d] QC programs in the MASTER area
- 2e] Incorporating the QC spreadsheet
- 2f] Creating the match and defining the status
- P3_COPYQCYN=Y: Copying QC programs from QC_MASTER/programs
- P4_RUNQCYN=Y: Running the QC programs
- P5_CHKLOGYN=Y: Checking the LOGs
Note when P2-P5 are run, the QC spreadsheet is updated after each of these tasks has been performed. This ensures the QC spreadsheet always reflects the latest information gathered.
For the remainder of the blog we will concentrate on P1-P2 and as a whole discuss the rest when identifying the status of each display.
Setting up the QC Reporting Environment
This is driven by macro variable P1_NEWDIRYN.
At this point in the paper we will be introducing examples of the code from the batch program, specifically the UNIX commands. These need to be surrounded by the SAS code in bold below to allow the UNIX commands to be run as part of the SAS batch program.
The code below creates the directories (mkdir) then copies (cp -p) the globprot.sas from the MASTER area to the reporting effort retaining the file permissions.
| %sysexec %str( | ||
| cd&m_lib; | QC_MASTER/programs | |
| cd ../../; | ||
| mkdir QC_&snapdt2; | QC_26SEP2011 | |
| cd ../QC_&snapdt2; | ||
| mkdir programs; | QC_26SEP2011/programs | |
| mkdir | ||
| cp -p &m_lib.globprot.sas&q_lib.globprot.sas; | ||
| ); | ||
The code below copies the qc_plan.csv template file from the MASTER area to the reporting effort ONLY if it doesn’t already exist in the reporting effort area. It also renames it to include the reporting effort snap date.
%if %sysfunc(fileexist(“&q_lib.qc_plan_&snapdt2d..csv”)) eq 0
%then %do;
%sysexec %str(
cp -p &m_lib.qc_plan.csv
&q_lib.qc_plan_&snapdt2d..csv;
);
%end;
Identifying the Information for the Displays to be QC'd (2a)
The code below navigates to the display output directory (cd) , then opens up each display and extracts the date/time stamp when the file was run (perl). The reason we didn’t take the Unixdate/time stamp was because the displays could have been copied to the display folder which wouldn’t accurately reflect the display information.
%sysexec %str(
cd&outdir_lib; Display directory
Internal date/time stamp
perl -nle ‘print “$ARGV: $&” if /(0[1-9]|[12][0-9]|3[01])
(JAN|FEB|MAR|APR|MAY|JUN|JUL|AUG|SEP|OCT|NOV|DEC)
(11|12)\ ([0-1][0-9]|2[0-3]):([0-5][0-9])/’ *.* >&q_lib.dd.txt;
);
Note: The perl code was provided by a colleague which saved us writing additional SAS code.
Identifying the QC Information (2B-2D)
The code below navigates to the reporting effort directory, creates a list of the QC programs only (ls -1) and a long list of the QC logs (including date/times) in this area (ls –el). This also navigates to the MASTER directory and creates a list of QC programs available.
%sysexec %str(
cd&q_lib ; QC snap directory
ls -1 qc_*.sas>&q_lib.qcprog.txt; 2b] QC programs
ls -el qc_*.log >&q_lib.qclog.txt; 2c] QC log
cd&m_lib; QC MASTER directory
ls -1 qc_*.sas>&q_lib.qcmaster.txt; 2d] QC programs
);
QC Plan Information (2E)
The data from the QC plan spreadsheet is imported into the batch program to maintain existing information. The following are a list of some of the variables within the spreadsheet with example entries.
Automated:
- DISPLAY: demo4_saf.htm
- DISPLAYINFO: /project/study/output/26sep11_srt/
- LINKVAR: demo4
- DISPDT: 28SEP11:16:20:00
- QCPROG: qc_demo4.sas
- QCLOG: qc_demo4.log
- QCDT: 01OCT11: 04:09:00
- STATUS: 0
- STATUSD: QCed
- ORDER: 28
- AUTO_COMMENTS: 1 MESSAGES - CHECK LOG (0 ERROR 1 WARNING 0 UNINIT 0 REPEATS)
Manual:
- MANUAL_COMMENTS: All values matched with the actual output
- QCPASSED_YN: Y
- QCAPPROVER: JO
- QCAPP_DATE: 01OCT11
Compiling the Information
Here is a summary of all the files created so far which will be used in the batch program to identity the status of each displays:
- dd.txt: Displays to QC (*):
- qcmaster.txt: QC programs in Master area
- qcprog.txt: QC programs in reporting effort area
- qclog.txt: QC log (*) in reporting effort area
- qc_plan*.csv: Existing QC_PLAN (*) contents
(*) The date/time derived variables are used to also identify the status and to ensure the QC information occurs AFTER the display has been created.
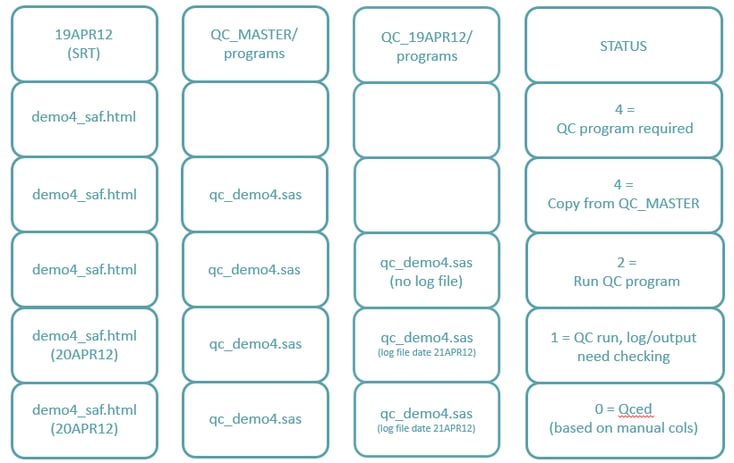
Creating the Match and Defining the Status (2F)
The table below provides an example for each status setting:
DISPLAYS TO QC QC PROGRAMS AREAS
The Importance of Documentation
Although the initial request was simple this did develop into a robust system which could be used by all. To ensure the system can be easily used by all users this system needs to be clearly documented. Any assumptions need to be explained and specific limitations of the system need to be identified. Examples about how to use the system will help the user work with the batch program. This should be a living document which is updated alongside any system modifications.
Audit File
In addition to the standard requirements, we have created an audit file which collates information every time the batch program is run. This way we can monitor the use of the program and the type of information which was required using the following 5 categories: AUDIT DATE, AUDIT TIME, USER, TASK and ADDITIONAL INFORMATION.
Examples of the contents of TASK are as follows:
- P1_NEWDIRYN=Y: Created directory QC_22NOV11 and subdir programs, output and log. Copied: QCSETUP.SAS, GLOBPROT.SAS and QC_PLAN.CSV from QC_MASTER/programs
- P2_QCVSOUTYN=Y: Identify which displays have QC programs in place, which need copying over from QC_MASTER/programs and which need developing
- P3_COPYQCYN=Y: Copied over QC programs from QC/MASTER/programs
- P4_RUNQCYN=Y: Ran QC programs
- P5_CHKLOGYN=Y: Checked logs
Additional information for P3 and P4 are the QC program names.
Benefits of the System
The benefits of the new robust system to the client were:
- One reference area for all the master versions of the QC programs. If updates were required these were only made in the master area
- The client had initially requested a full automated system but with the flexibility to manually run individual QC programs independent of the system. This includes the benefit that next time the system was run, it picked up the findings from the individual runs which allowed for maximum flexibility
- Having a mainly automated system enabled QC programs for SRT displays to be generated in minutes rather than hours. This looked into the displays and worked out which QC programs were required, ran them, and collated the findings into one central document
- Each reporting effort was self contained with Programs, Logs and Outputs related to that delivery
- Consistency with directory structure and QC program naming convention enable programmers to move around the reporting efforts with ease
- With careful planning upfront the new system which was built was robust and dynamic
Conclusion
To achieve high-quality results, it is essential for programming teams to strategically plan their QC processes and regularly assess the quality of both their deliverables and their methods. This article demonstrated that using SAS quality control and automated batch programs can help meet these needs. Communication and involvement by all stakeholders will ensure that the resulting system is easy to use, relevant, and includes all appropriate steps to ensure quality and consistency. Ultimately, while delivering accurate and timely results is important, maintaining a reliable and consistent QC process is equally crucial in the pharmaceutical industry.