
Randomization is widely acknowledged to be one of the more, if not the most, important parts of a properly planned and designed clinical trial. Flaws at a randomization level might lead to systematic imbalances in the allocation of patients to treatment groups, ultimately resulting in a lack of control of the overall type I error (i.e.: the pre-specified α level used as a reference for hypothesis testing). Whilst generation of randomization lists based on ‘static’ algorithms (e.g. stratified algorithms) is a relatively easy and standard process that can be done using standard software, a new type of method, that we’ll refer to as ‘dynamic’ randomization, is also increasingly used. This requires more complex algorithms to be embedded in the Interactive Web Response System (IWRS) integrated with the study database. The reason for this is that whilst with common algorithms the list of treatment allocations is fully determined a priori, i.e.: before we know the characteristic of the subjects that will be randomized, dynamic methods generate the randomization list case-wise, that is only when a new patients come in, using minimization algorithms to make sure that the groups are balanced with respect to specific characteristics not only when all subjects have been recruited, but during the whole recruitment process.
Whilst very appealing in the presence of a number of stratification factors that would make static methods impractical, regulators have suggested that these methods might not achieve full control of the nominal type I error, thus leading to an increased chance of a ‘false positive’ claim of, e.g., effectiveness.
To circumvent this problem, the EMA suggested/advised re-randomization tests to complement analyses obtained via standard methodology, in order to support the main study results and provide definite proof of efficacy/safety of a new drug/compound [1].
Re-randomization within Superiority Studies
The way these methods work is relatively intuitive. Suppose the trial was aiming at demonstrating superiority of drug A vs drug B and that the estimated test statistic resulted in p < 0.05. Without entering into the general wave of criticism of how p-values are often misinterpreted, we will just assume that this result would be, given that the randomization was in fact performed correctly, suggestive of superiority of A vs B. Now, if we assume that the null hypothesis of no difference (i.e.: A = B) is true, that means we can re-shuffle patients and randomly re-assign them to treatment A or B, and then estimate the very same test statistic. We do this several times (1000 is a good starting point) and then we calculate how many times the re-shuffled test statistics are more extreme than the original one. If this proportion is larger than a pre-specified threshold (usually set to be equal to the type I error level, α), then this means that you would have a larger difference between groups even if the null hypothesis was true, thus meaning that the observed result (the original ‘significant’ one) can’t really be used to reject the null hypothesis itself.
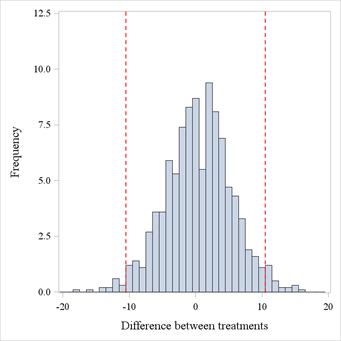
This is better visualized graphically in Figure 1. We simulated data for 200 patients, allocated in a 1:1 ratio to 2 treatments. The simulation settings were such that the underlying distributions for the treatments were in fact identical, but we’ve picked up a seed where a significant result showed up, in this case a p-value of 0.035 (with a difference between proportions of 0.1033). Then, we’ve re-shuffled treatment labels 1000 times, and calculated difference between proportions for all these re-shuffled datasets, and these are displayed in Figure 1. If we count how many values are outside of the red margins (which are A – B and B – A in terms of difference in proportions) we find a proportion of 0.052 more extreme values. In other words, whilst the original analysis seemed to suggest there was a difference, the re-randomization tests hints at the fact that the original result might have been just a ‘luck of the draw’, and maybe the difference observed was not really due to the treatment itself, but rather to something else, e.g. a systematic difference between patients belonging to the 2 groups.
Figure 1. Re-randomized test statistics distribution. Dashed red lines represent the original test statistic estimates.
Re-randomization within Equivalence Studies
The question now would be: can we use these tests in an equivalence trial involving dynamic randomization? The answer is both yes and no: yes, you can perform a supportive/secondary analysis using a similar approach but no, you can’t interpret the results the same way you’d do in a superiority trial. The reason for the latter is, simply stated, that re-shuffling within an equivalence trial happens under the alternative, rather than the null, hypothesis, and as such one could not say what would happen if the null was true and how this would compare to the original study result. On the contrary, if equivalence was not achieved under ‘equivalent conditions’ (i.e.: when assuming that treatment labels could be re-shuffled randomly across patients), then one could argue that if the study original results had in fact been suggestive of equivalence we’d be in presence of another ‘luck of the draw’ result, although reversed with respect to the superiority study example above.
The procedure to follow in an equivalence trial can be better illustrated with an example using binary data, but the approach would be identical for any type of data. We simulate data from 300 patients, randomly allocated to 2 treatment groups in a 1:1 ratio, with a true treatment difference of 10%. In this context, medical knowledge and historical studies confirm that a difference of 10% is the largest difference we’d have to observe to be able to claim equivalence (for a more detailed discussion on equivalence testing refer to [2]), so that a ±10% margin needs to be considered for the sake of hypothesis testing. Results from this simulation are reported in Table 1 below. The Two-One Sided Tests (TOST) procedure, which involves performing two separate one-tailed tests, returns two p-values and the larger of them is the overall TOST p-value. In this case we define α = 0.1, thus having a TOST p-value < α/2, consistent with the confidence intervals approach to equivalence testing, that entails assessing whether the CI at 1 – α confidence level is fully contained in the equivalence margin (which is the case here, see the last column).
Table 1. Simulation results
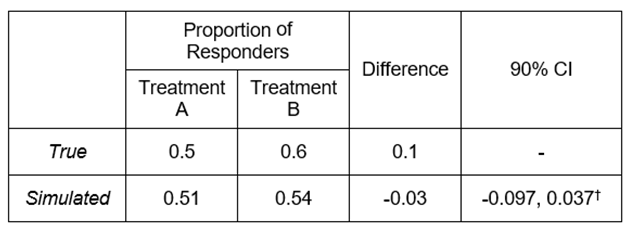
† TOST p-value = 0.0429 (using a margin of -0.1 to 0.1).
The way we perform re-randomization is similar to what was seen in the previous example, the main difference being that what we count is not just the amount of re-shuffled test statistics more extreme than the original one, but rather how many times the reshuffled test statistics are either larger than the upper bound of the equivalence margin plus the original test statistic or smaller than the lower bound minus the original test statistic, i.e.::
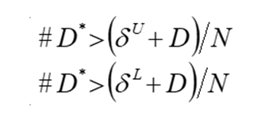
where N is the number of re-shuffling (or re-randomization) that were done. In our case, we get a lower-bound re-randomization p-value < 0.0001, and an upper bound p-value of 0.059, thus suggesting that the null hypothesis that the treatments are not equivalent can’t be rejected, unlike what the original results seemed to suggest. Conversely with what we said for the superiority trial, we could thus argue that even if we assumed that the alternative hypothesis of equivalence was true (as we did for the re-randomization test) we might be getting non-equivalent results, thus implying that the original results can’t be considered conclusive of equivalence at all.
Final Remarks
The main advantage of this kind of test is that, being very close to a standard permutation approach, they can be used without any assumption of the distribution of the test statistic, and in certain situations can provide further substance to efficacy and/or safety claims for pivotal studies, pre-emptying regulatory concerns on type I error control. On top of that, they can be implemented in most standard software (e.g. SAS, R), the only ‘limiting’ factor ultimately being the sample size and the number of re-shuffling, which might have an impact on computational feasibility.

Quanticate's statistical consultants are among the leaders in their respective areas enabling the client to have the ability to choose expertise from a range of consultants to match their needs. If you have a need for these types of services please request a consultation and a member of our Business Development team will be in touch with you shortly.
References
[1] EMA/CHMP/295050/2013 Guideline on adjustment for baseline covariates in clinical trials.
[2] Wellek S. Testing statistical hypotheses of equivalence and non inferiority. Second edition. Boca Raton: Chapman & Hall/CRC Press, 2010


.png?width=140&name=cdisc_gold_partner_80h%20(2).png)
