 The blog was orginally presented by one of our statistical consultants at the Statisticians in the Pharmaceutical Industry (PSI) 2017 conference.
Inflammatory rheumatic diseases, such as ankylosing spondylitis (AS), are a major cause of work disability. Despite clinical progress in inflammation control and associated improvements in outcomes, work disability remains an issue for AS patients, and other underlying causes, such as fatigue, have been postulated. We have used data from an observational study, which followed a large cohort of AS patients in routine clinical practice for 12 months, to investigate the longitudinal relationship (data at baseline, 6 and 12 months) between fatigue and work disability in the presence of other recognised confounders. Initial results suggested possible inter-relationships between the effects of fatigue and anxiety/depression, leading to a post-hoc hypothesis that:
“The effect of fatigue on work productivity loss (WPL) is mediated by anxiety/depression (A/D)”.
Method
Mediation methods described in the literature generally focus on relationships between continuous (or dichotomous) dependent variables, continuous (or dichotomous) independent variables and continuous mediators. Methods aim to quantify the direct effect of the independent (X) on the dependent (Y) (i.e. the effect of X on Y having accounted for the mediator (M)) and the indirect effect (i.e. the effect of X on Y due to the effect that X has on M and M, in turn, has on Y) in order to understand the mechanism by which the independent affects the dependent. If all continuous variables are standardised and binary variables coded 0/1, the effects can be interpreted as the expected change in Y due to a unit change in X. For the indirect effect, a unit change in X will cause a change in the expected value of M, which will result in a change in the expected value of Y. The process (for all continuous variables) is illustrated below:
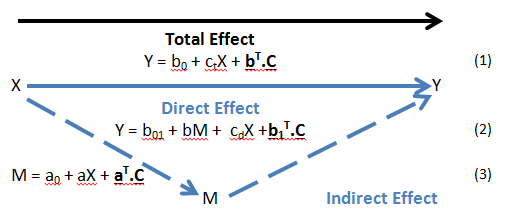
Key:
Y – Dependent Variable
X – Independent Variable
M – Mediator
C – Other Covariates
By Equation (1) If X changes by 1 unit, E (change in Y) = ct – Total Effect
By Equation (2) If X changes by 1 unit, E (change in Y) = cd – Direct Effect
By Equation (3) If X changes by 1 unit, E (change in M) = a
By Equation (2) If M changes by “a” units, E (change in Y) = a.b - Indirect Effect
ct, cd, a and b can found from the coefficient estimates in linear regression (using, for example, SAS PROC GLM). The “a.b” product can then be calculated; and the 95% confidence interval (CI) found by bootstrapping methods (as the a.b product will not be normally distributed).
However, in our study not all variables are continuous:
Y = Work Productivity Loss: calculated as a percentage and so a continuous variable;
X = Fatigue: patient-assessed on a Visual Analogue Scale (VAS) and so a continuous variable; but
M = Anxiety/Depression: patient-assessed using the anxiety/depression dimension of the European Quality of Life 5 Dimensions (EQ-5D) questionnaire and so an ordinal variable (None/ Some/ Extreme problems). We dichotomised this variable as None (M=0) vs. Some/ Extreme (M=1) due to a low “Extreme” event count.
The model relating X to M then becomes:
P(M=1) = exp(a0 + aX + aT.C) / (1 + exp(a0 + aX + aT.C)) (4)
To quantify the indirect effect, we need to estimate the difference in probabilities (P(M=1)) for a unit increase in X (and then estimate the expected change in Y for this estimated change in M). Logistic regression models model the log odds rather than probabilities (in the linear predictor) and so estimating the probability difference is not straight-forward.
The solution was to model the probabilities (rather than log odds) using a binomial distribution and identity link1 (using SAS PROC genmod/glimmix) so that the expected change in Y due to a unit change in X via the binary mediator is again given by the a.b product. The 95% CI can again be found by bootstrapping. PROC GENMOD and PROC GLIMMIX give very similar results but the standard errors (and so 95% CI) tend to be more robust using PROC GLIMMIX.
The model relating X to M then becomes:
P(M=1) = a0 + aX + aT.C (5)
Analysis
SAS macros were developed to calculate the direct and indirect effects (with 95% CIs) for all combinations of continuous/binary Y, X, and M. Where the mediator was binary, the above approximation method was used. This allowed all pathway strengths to be estimated with the 95% CIs indicating significance (at the 5% level) or not.
Because the method used for the binary mediator was an approximate method, an additional SAS macro was developed to implement a method by Dawn Iacobucci2 which tests the significance of the mediating effect. This method calculates a Z statistic based on the standardised coefficients of X in the model to M ((3) or (4)) and the standardised coefficients of M in the direct path model (2), which can be used to test significance; but it does not estimate the indirect effect (pathway strength).
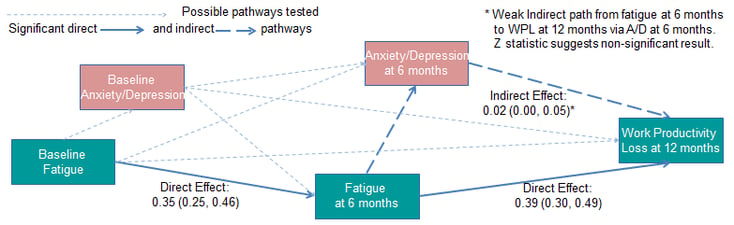
All direct and indirect pathways from fatigue at baseline to work productivity loss at 12 months were then estimated. The estimated strengths of the pathways and significance levels were used to build a picture of the causal relationships between fatigue and work disability. Significance levels were corroborated via the Z statistic.
Results
Conclusions
The methodology has allowed us to evaluate the hypothesised causal chain; and specifically, to investigate and understand the mechanism by which fatigue affects work productivity loss.
The results suggest that the strongest pathways from fatigue to work productivity loss are direct; and do not support the hypothesis of mediation through anxiety/depression.
It is an approximate method and hence the use of the 2nd method to corroborate significance. It is important to use the balance of: (i) pathway strength; (ii) significance of pathway strength implied by the confidence interval estimated; and (iii) significance of the mediating effect assessed via the Z statistic; to make inferences about causal relationships.
The method can be developed to use with multi-categorical variables.
Quanticate's Statistical Consultancy team have performed statistical analysis and support for drug development companies on several observational studies. If you are interested in learning more about how we could support your observational study, request a consultation and a member of Quanticate's Business Development team will be in touch with you shortly.
References
1. SAS Usage Note 37228. Online at http://support.sas.com/kb/37/228.html#note1
2. Iacobucci D. Mediation analysis and categorical variables: the final frontier. Journal of Consumer Psychology 22 (2012) 582-594. Online at www.sciencedirect.com


.png?width=140&name=cdisc_gold_partner_80h%20(2).png)
