Rheumatoid Arthritis (RA) is a long-term inflammatory disease that causes pain, swelling,
stiffness and loss of function in joints, with an approximately 0.5 to 1% (and increasing) prevalence in adults worldwide. Alongside many treatment options, there’s recently been an increased focus on producing biosimilars, with many new drugs expected to come to the market in the coming years [1].
As well as comparing the reference product and the biosimilar at a given time-point as is usually done, comparing treatment response pattern over relevant periods of time, e.g. during the early onset of treatment effect, is a crucial point which has previously been given poor attention.
Equivalence assessment in Rheumatoid Arthritis
In a randomized clinical trial (RCT) aiming at showing equivalence of a biosimilar to a reference product within RA, the most used endpoint is the American College of Rheumatology (ACR) 20, a composite binary score with a value of 1 if at least a 20% improvement (i.e. a decrease) from Baseline in both swollen and tender joints count and at least 3 out of 5 other indicators is observed, and 0 otherwise. Equivalence assessment is performed by estimating the amount of ACR20 responders in each treatment group at a pre-specified time-point, usually in correspondence of the ‘plateau-phase’ of the drug effect (in RA this is usually 4 to 6 months after Baseline), and then the difference between responders rate is estimated alongside a confidence interval, which is compared with the pre-specified margin. If it is fully included in the margin, then equivalence is concluded.
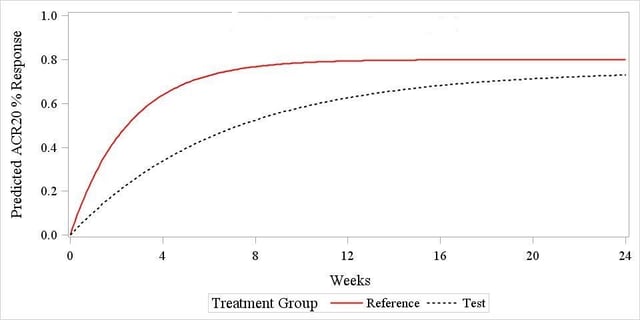
Recently, however, it has been pointed out that ‘[…] Demonstration of equivalent clinical responses during the earlier, rapid rise phase of the time response curve would provide additional information on biosimilarity […]’ [2], suggesting that exploring the response patterns during the early onset phase is a relevant issue that needs to be addressed using suitable methods. The rationale for this is that the two drugs displayed in Figure 1 below (results coming from simulated data) would most likely ‘pass’ the usual end-of-trial assessment, despite the fact that their ACR20 response pattern is substantially different at the beginning of the trial, suggesting that the two are not ‘early equivalent’, and this is something that would deserve some further investigation.
A simulation study
The model used to simulate the data was proposed by Reeve et al. [3] and it has been described and used in previous blogs titled; Assessing Equivalence in Rheumatoid Arthritis in Clinical Trials and Comparing treatment response curves: a practical example in rheumatoid arthritis, thus will be treated as already assimilated by the reader. With reference to Figure 1, the ACR20 response pattern is shown to follow an exponential pattern that can be modelled by specifying three parameters: a β slope for the response curve, that can be interpreted as the ‘speed’ at which the drug effect starts to onset, a horizontal asymptote α for the reference drug curve, representing the ‘peak effect’ of the drug, and a parameter θ describing the differential peak effect of the biosimilar and reference drug.
Starting from the above model, we have simulated data under different scenarios:
- Varying values of β and α (holding θ fixed and equal to 0)
- Increasing value of overall sample size (80 to 500, with a 1:1 allocation ratio)
- Increasing drop-out rate (assumed to follow an exponential decay, i.e. withdrawal more likely at early time-points)
- Adding a normal random effect η ~N(0,σ) to α
Each scenario has been simulated 1000 times, and on each occasion the data have been analysed using three methods: a weighted mean approach, a GEE approach (click here for the detailed explanation) and a GLMM approach. For the two modelling methods, an assessment of the effect of different correlation structure between observations and of different covariance structures for the random effects has also been performed.
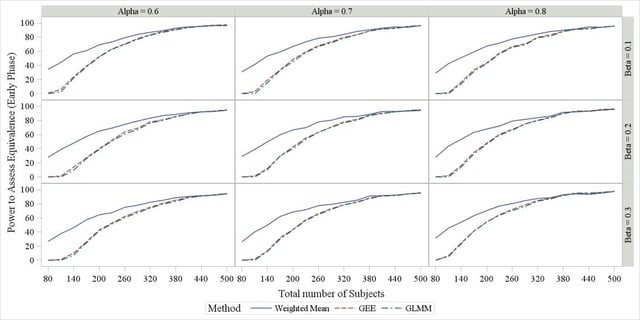
A snapshot of the results is available in Figure 2 for the first item of the scenario list above (effect of β and α), suggesting that no matter the value of the two parameters, all methods have identically large power in concluding equivalence when sample size >400. On the other hand, for small samples the weighted mean achieves a substantially larger power. Similar trends were observed under the other scenarios introduced above, the only one really leading to any difference being the presence of a random subject effect around the plateau α, in which case a small drop in the power profile was observed for the GLMM method. No difference in power was observed among covariance and correlation structures (results not shown).
Application to real data
We have applied the above three methods to data from a RA equivalence trial (N < 200), estimating both the difference between drugs at Week 22 (assumed here to be the relevant time-point) and the early phase equivalence up to Week 14, and obtained the results displayed in
Table 1. What we can see is that compared to a margin of ±13% both the weighted mean and the GEE method allow to conclude for equivalence, whereas this is not the case for GLMM, possibly due to the low sample size which doesn’t allow for sufficiently precise estimates. Notably, this is in line with the simulation results, where performance of GEE and GLMM for low sample size was seen to be substantially poor compared to the weighted mean. The narrower CI for the Weighted Mean approach is possibly due to the fact that lower sample sizes can pose a challenge to GEE and GLMM to reliably estimate correlation and covariance matrices, whereas this issue is not relevant to the weighted mean, which is in fact assuming that the measurements at different time points are not correlated (an assumption which is likely to be violated, although the impact of this has not been investigated yet).
Table 1. Early-phase equivalence analysis
|
Analysis Method |
Estimate (Test – Reference) |
95% CI |
|
Weighted Mean |
-5.93% |
-7.69, -4.17 |
|
GEE |
-4.26% |
-12.53, 4.02 |
|
GLMM |
-4.26% |
-14.69, 6.18 |
Conclusions
The following can be concluded:
- Assessing early phase equivalence is a relevant topic that should be addressed alongside the standard ‘end-of-trial’ assessment;
- with sufficiently large sample sizes all the proposed methods achieve a desirably large power, although GEE and GLMM might encounter convergence issues;
- with small sample sizes the weighted mean method works better, although it doesn’t account for correlation between repeated observations.
Learn more about how our statistical consultancy group could support your clinical trial by requesting a consultation below.
References
[1] T Dörner, V Strand, P Cornes, J Gonçalves, L Gulácsi, J Kay, TK Kvien, J Smolen, Y Tanaka and GR Burmester The changing landscape of biosimilars in rheumatology. Ann Rheum Dis 2016; 0:1–9.
[2] J Kay and JS Smolen Biosimilars to treat inflammatory arthritis: the challenge of proving identity. Ann Rheum Dis 2013; 72(10)
[3] R Reeve, L Pang, B Ferguson, M O’Kelly, S Berry and W Xiao Rheumatoid Arthritis Disease Progression Modeling. Ther Innov Regul Sci 2013; 47(6): 641-650